
Uses
Create charts to present data visually. Communicate data with AI-assisted visualization.

Tool profile · Publisher documentation
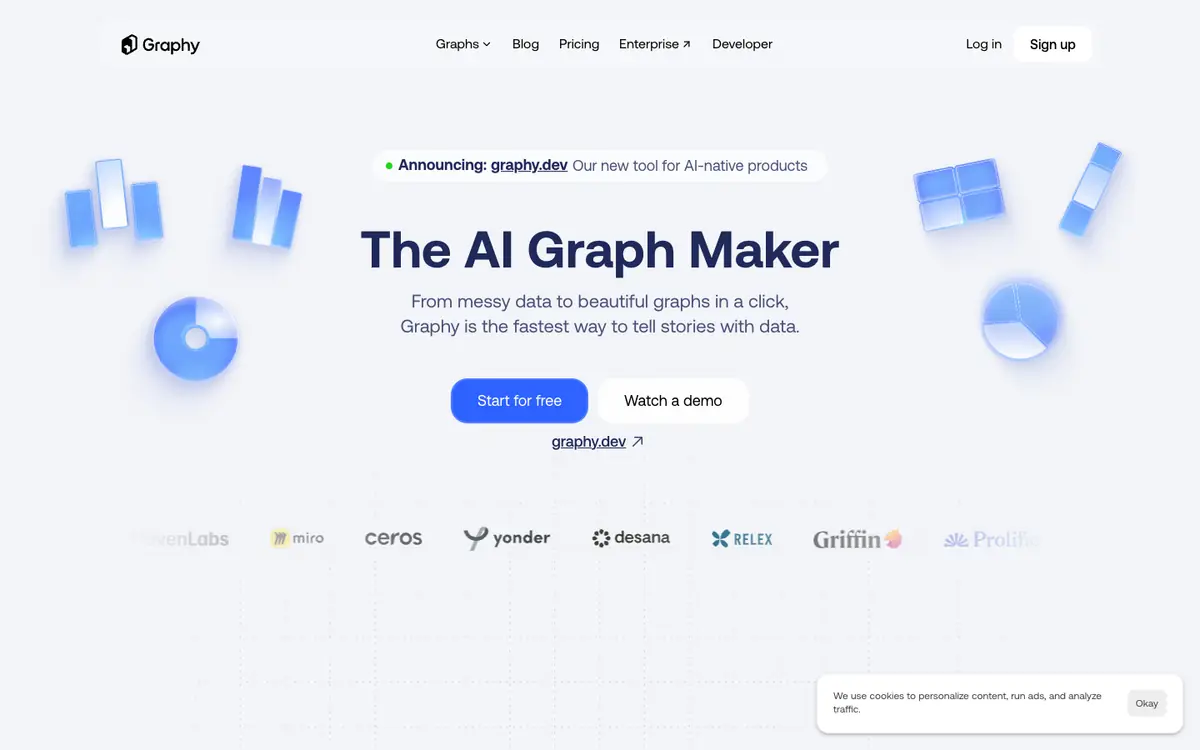
Graphy is a data visualization tool designed to help create charts and present data, using AI assistance to simplify how information is communicated. According to public documentation, Graphy enables anyone to become a skilled data storyteller. LE LABO IA has not tested the product, and this profile relies on the public documentation of its supplier. Documented uses include chart creation and data presentation. The exact scope of the AI assistance and how it works in practice are not detailed in the available public documentation. Pricing starts with a free tier of 0 USD for 5 charts, then Plus at 16 USD per user per month with unlimited charts, and Business at 36 USD per user per month, with an announced 20 percent annual discount. These prices and terms are not confirmed and should be checked with the supplier before committing. Availability by country is not confirmed. Graphy may suit people who need to present data visually, but it may not fit those with strict volume limits or specific regional requirements.
Tool profile · Publisher documentation
The product points below come from publisher documentation. No common hands-on test is claimed. Documentary profile, sources checked October 6, 2026. LE LABO IA has not tested this product.
Create charts to present data visually. Communicate data with AI-assisted visualization.
Public pricing shows a free tier at 0 USD for 5 charts, Plus at 16 USD per user per month with unlimited charts, and Business at 36 USD per user per month, with an announced 20 percent annual discount. These prices and terms are not confirmed and should be checked with the supplier.
The available public documentation does not specify quotas, territorial availability or detailed usage terms. Prices, chart limits and the announced annual discount are not confirmed and should be checked with the supplier. LE LABO IA has not tested the product, so the profile relies on the public documentation of its supplier.
Before committing, check the supplier site for the current free tier, its chart limit, and the exact prices for Plus and Business. Confirm which AI-assisted features are included and how many charts each plan allows. Also verify that the product is available in your country and that the terms of use match your needs.